kchmielewski02.github.io
Team ERA and its Effect on Winning
This Repo is the final project for our Data Science class at Lafayette College. It investigates the effect Team Earned Run Average has on total wins.
Business Understanding
Earned Run Average (ERA) is a statistic that states the number of earned runs a pitcher allows per nine innings, with earned runs being any runs that scored without an error or passed ball. Specifically, ERA is calculated by the following: (9 x earned runs) / innings pitched. An ERA between 4 and 5 is considered average, which means that an average pitcher would give up between 4 and 5 earned runs per game. In general, an ERA between 2 and 3 is considered excellent and is only achieved by a select few pitchers each year, while between 3 and 4 is considered above average. An ERA above 5 is considered below-average and a pitcher with an ERA above 6 for too long will usually be demoted to a lower league. Since ERA is the most commonly accepted statistical tool for evaluating pitchers, it is clearly very important to baseball. Specifically, ERA is a great way to evaluate a pitcher’s effectiveness in limiting how many earned runs they give up over nine innings. For example, the ERA stat line is widely accepted as a better metric instead of how many wins a pitcher got. Since preventing runs is just as important as getting them in baseball, it is not surprising that the correlation coefficient between ERA and Winning Percentage is -.6. This number means that there is a significant negative correlation between a team’s ERA and its winning percentage. In simpler terms, the data says, “the lower a team’s ERA, the higher its win percentage.” In summary, ERA plays a critical role in a teams success, so it is clearly extremely important and must be considered in this project.
Data Understanding
Our data came from Baseball Reference, which is a website that has play-by-play statistics for every game dating back to the 1960s. We utilized their database to access team batting and pitching statistics for the years 1985-2016.
Our Variables:
yearid: year, Ordinal
teamid: team initials, Interval
game_t: total games, Interval
win_t: win total, Interval
era_t: Team Era, Ratio
teamname: Team Name, Nominal
teamOPS: Team OPS, ratio
wswin_t: World Series Winner, Nominal
run_t: Total Runs, Interval
hit_t: Total Hits, Interval
hr_t: Total HRs, Interval
bb_t: Total Walks, Interval
so_t: Total Strikeouts, Interval
runallow_t: Total Runs Allowed, Interval
earnrun_t: Total Earned Runs, Interval
save_t: Total Saves, Interval
errors_t: Total errors, Interval
Link to Baseball Reference:
https://www.baseball-reference.com
Data Preperation
To prep for our project, we cleaned that data by dropping variables we didn’t need such as some advanced statistics like OPS+ and other irrlevant statistics like CS. All in all we ended up with 918 observations with 17 variables.
Exploratory Data Analysis
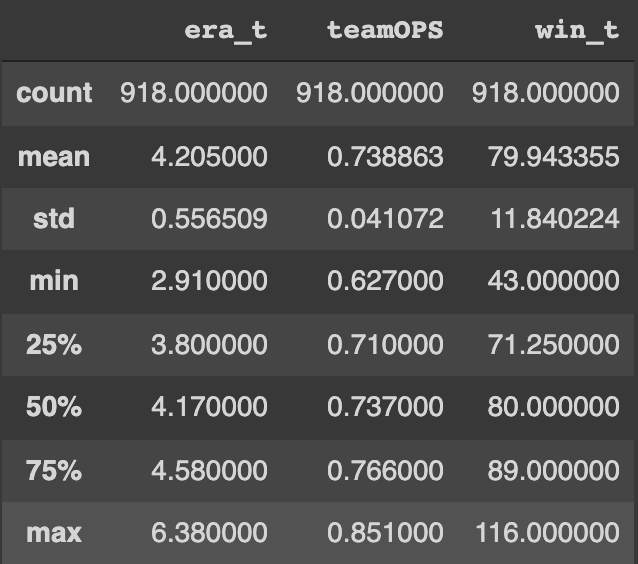
Summary Statistics
Looking at the summary statistics, we can see that the average team ERA is 4.205. The average team OPS is .738. The average amount of wins is 79.94.
Some of the best teams in MLB history are included in our data set, with the ERA record is held by the 1988 Mets with a 2.91 team ERA. The best hitting team being the 2003 Boston Red Sox with a .851 OPS. And Lastly the 2001 Seattle Mariners with a 116 win season.
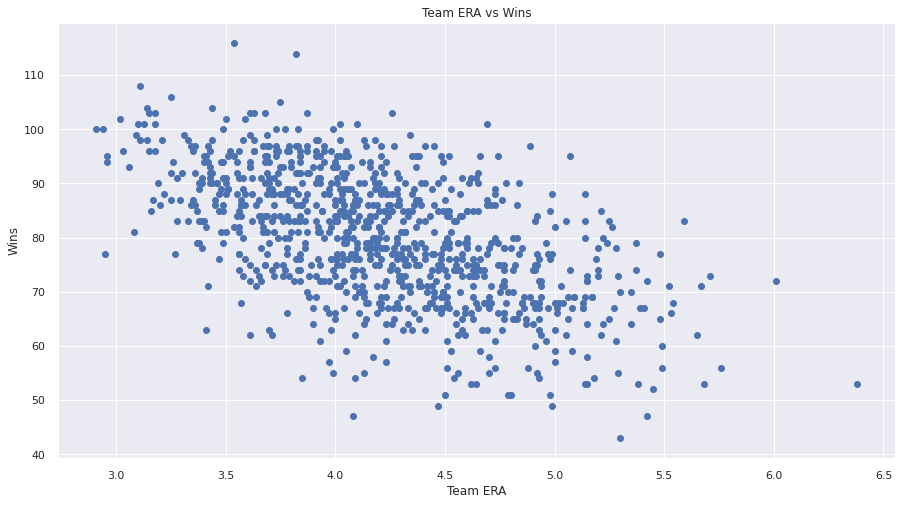
Scatter Plot of Team ERA vs. Wins
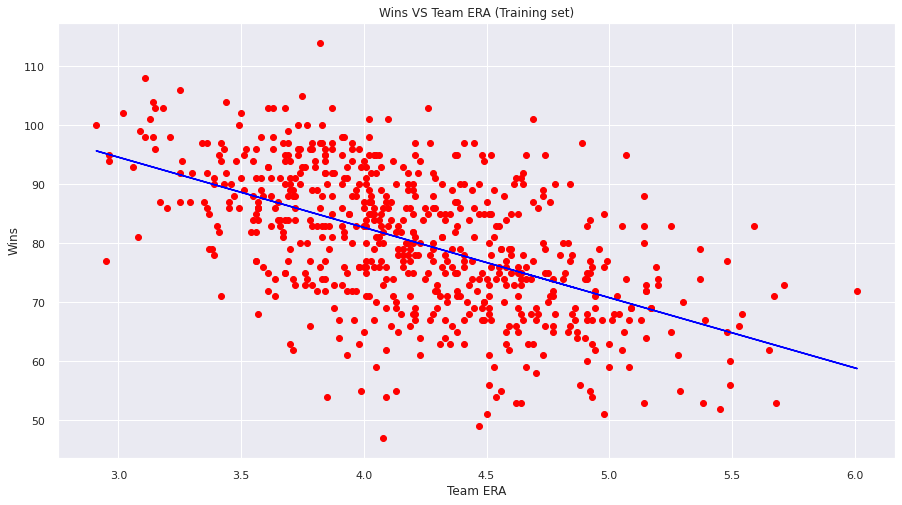
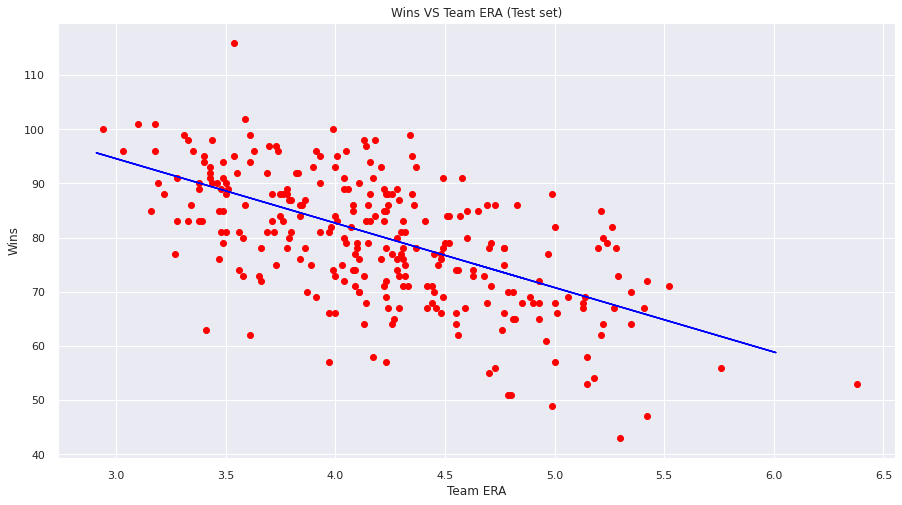
Looking at the scatter plot, we can see there is a solid negative linear relationship. As the team ERA goes up wins go down.
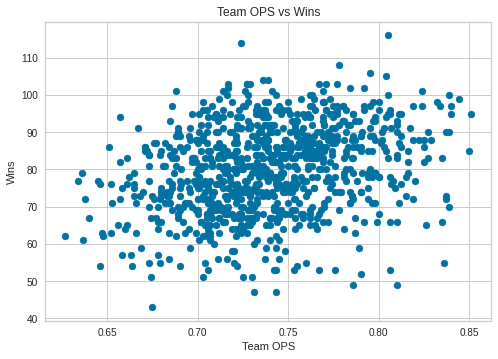
Scatter Plot of Team OPS vs. Wins
Looking at the scatter plot, we can see there is a loose positive linear relationship. As the team OPS goes up wins go up, however the relationship is not as strong as team ERA.
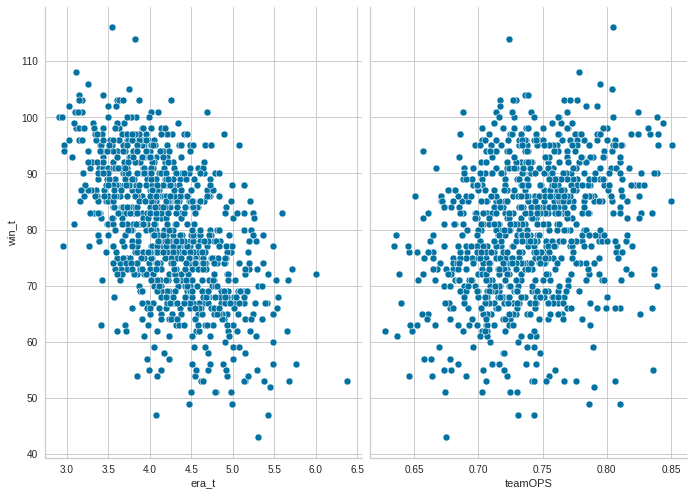
Comparison of Scatter Plots
Looking at the batting and pitching metrics next to eachother it is clear to see that team ERA is more strongly correlated with winnning than team OPS.
Heatamp of Correlation
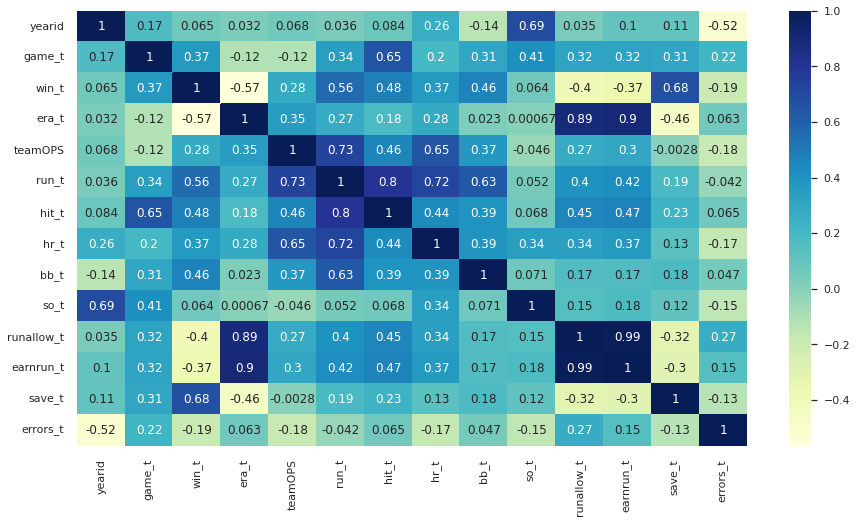
Our heatmap confirms our earlier assumption that team ERA has a greater correlation to winning than team OPS, as the correlation coeffcient for team ERA is -0.57, which has the highest absoulte value of any of the other values.
Machine Learning Model
Linear Regression Model
After running the linear regression model, we found a slope coefficient of -11.90192868, meaning that for every additional point of team ERA a team wins 11.9 less games. This regression has a Y-intercept of 130.3.
When evaluating our model, we used the the metrics of RMSE and R^2. Where the most intuitive metric is R^2, where 1 means a perfect linear fit, our model’s R^2 0.36, which is a pretty good linear relationship for a single pitch metric.
Training Set Graph
Test Set Graph
Predictions
With our model, we can predict that a team with a 2.5 ERA would win 100.55 games. Then we predict a team with a 5 ERA would win 70.79 games.
Residual Graph
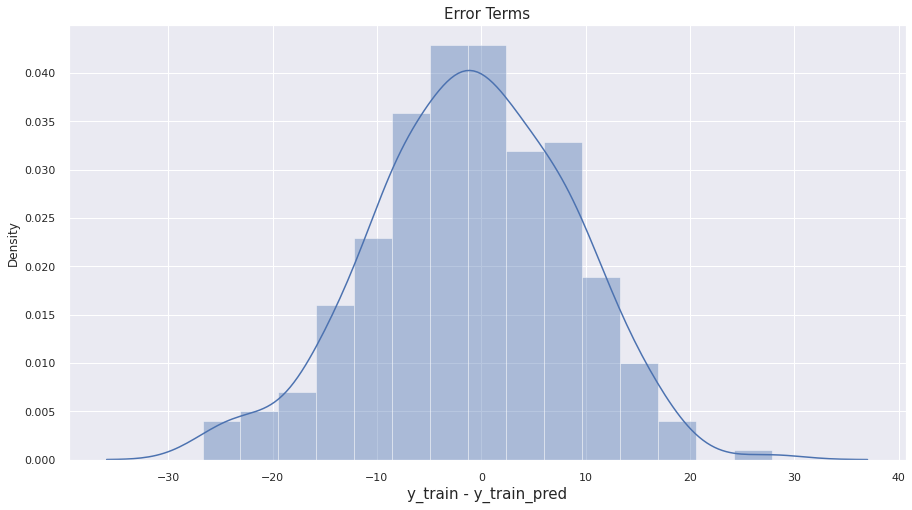
In order to make valid inferences from our regression, the residuals of the regression should follow a normal distribution. Clearly our residual graph, shows a normal distribution of the error term. This means that our estimates are valid and true.
Conclusions
A quick watch of the movie “Moneyball” shows the potential of data analytics in sports, specifically baseball. If used properly, the right data can turn a bad team into a championship group in a single season. That being said, the movie focused almost only on the offensive side of baseball, so our group decided to delve into some of pitching statistics instead. As expected, we found that good pitching is highly correlated to a ballclub that wins a lot of games. Specifically, in both the test and training set, there was a clear negative correlation between team ERA and team wins, meaning that a lower/better ERA translates to a team getting more wins. That being said, the most interesting part of this project came from when we analyzed hitting metrics in addition to pitching stats, and we found that good hitting actually correlate less to winning than good pitching from our correlation heatmap. With so much emphasis placed on the offensive side of baseball, it’s surprising to find that pitching is actually more important to winning games. This study has shown that general managers should probably stop giving so much of their overall budget to hitters and instead recruit pitchers that get outs. Also, ballclubs tend to prefer pitchers with very high velocity, but our research has shown that it doesn’t matter how hard a player throws as long as he can get outs. In conclusion, while hitting and the offensive side of the game is a very important part of baseball, our code shows that pitching, specifically a lower team ERA, is much more correlated with a ballclub winning a lot of games. Therefore, if teams want to win a World Series, they should stop looking for expensive hitters and pitchers who “fit the profile,” instead getting pitchers that are effective and have low ERAs.
Run Notebook In Google Collab
Click the link below to run our notebook directly in Google Collab. No coding is required to run this notebook, you just need to run every code cell in order or simply click Runtime -> Run all and wait for all cells to run.
 Run in Google Colab Run in Google Colab
|